The financial information contained in this press release is based on
Third Quarter of 2026 Highlights
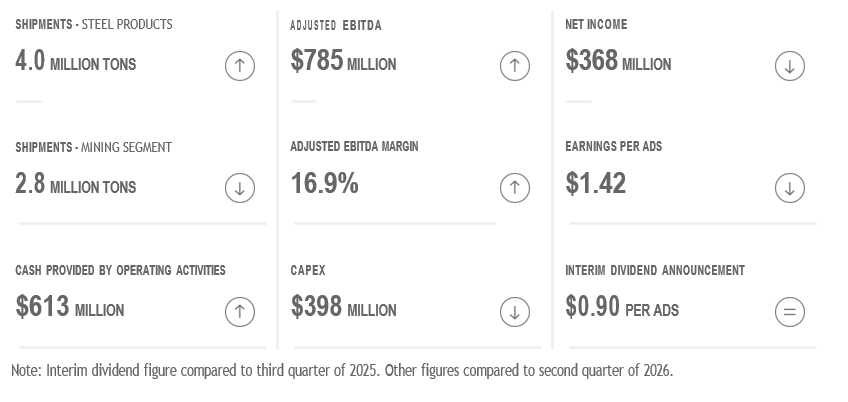
Summary of Third Quarter of 2026
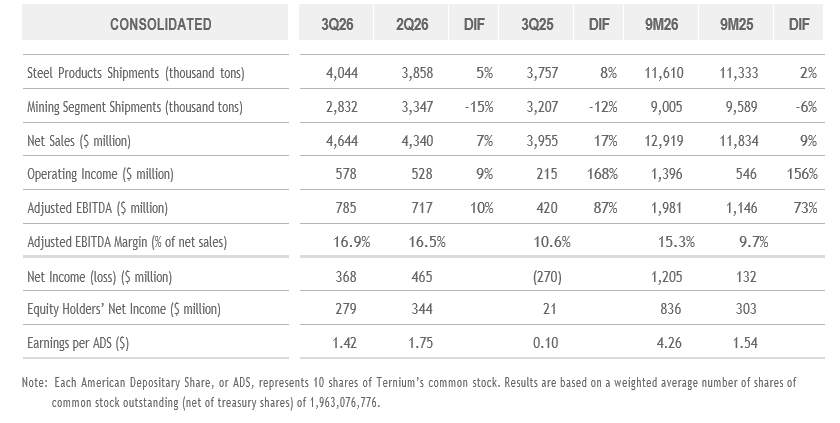
Third Quarter of 2026 Highlights
In
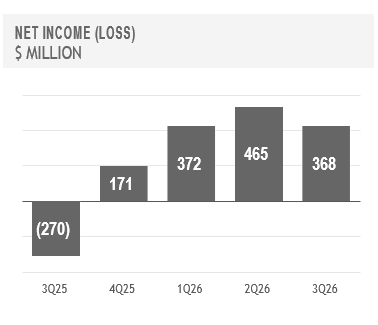
The company's net income in the third quarter of 2026 reached
Capital expenditures amounted to
Interim Dividend Payment
The interim dividend payment date will be
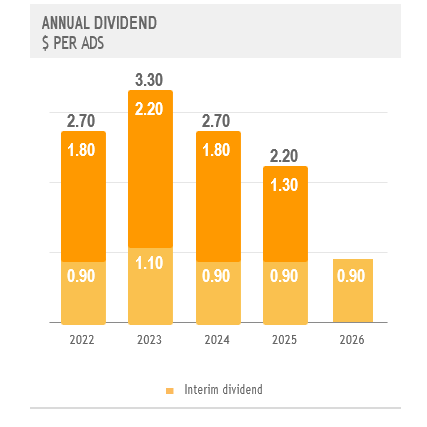
Outlook
In
In
In the
Analysis of Third Quarter of 2026 Results
Consolidated
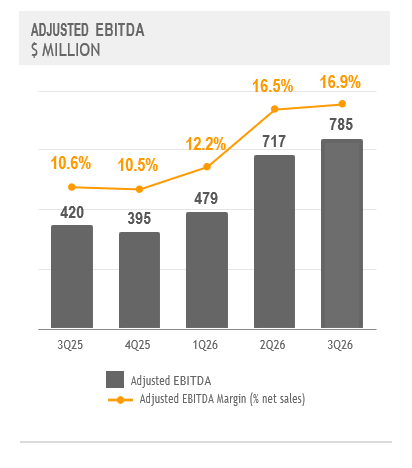
Adjusted EBITDA
Adjusted EBITDA in the third quarter of 2026 equals Net Income adjusted to exclude:
- Depreciation and amortization;
- Income tax results;
- Net financial results;
- Equity in earnings of non-consolidated companies; and
- Provision for ongoing litigation related to the acquisition of a participation in Usiminas.
And adjusted to include the proportional EBITDA in
Adjusted EBITDA margin equals Adjusted EBITDA divided by net sales.
For more information see Exhibit I - Alternative performance measures - "Adjusted EBITDA".
Steel Segment Third Quarter of 2026 Results
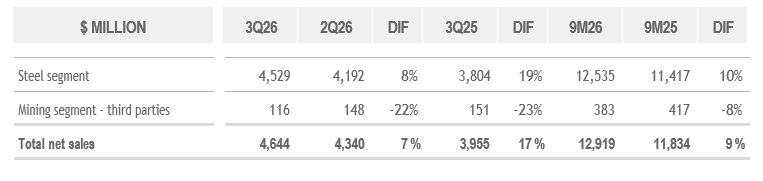
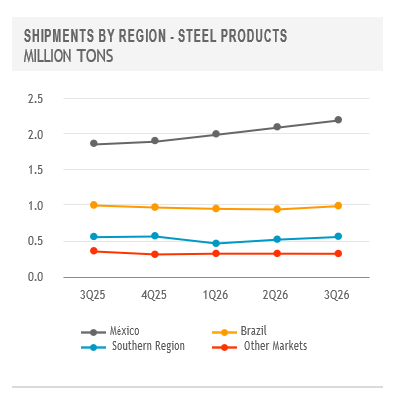
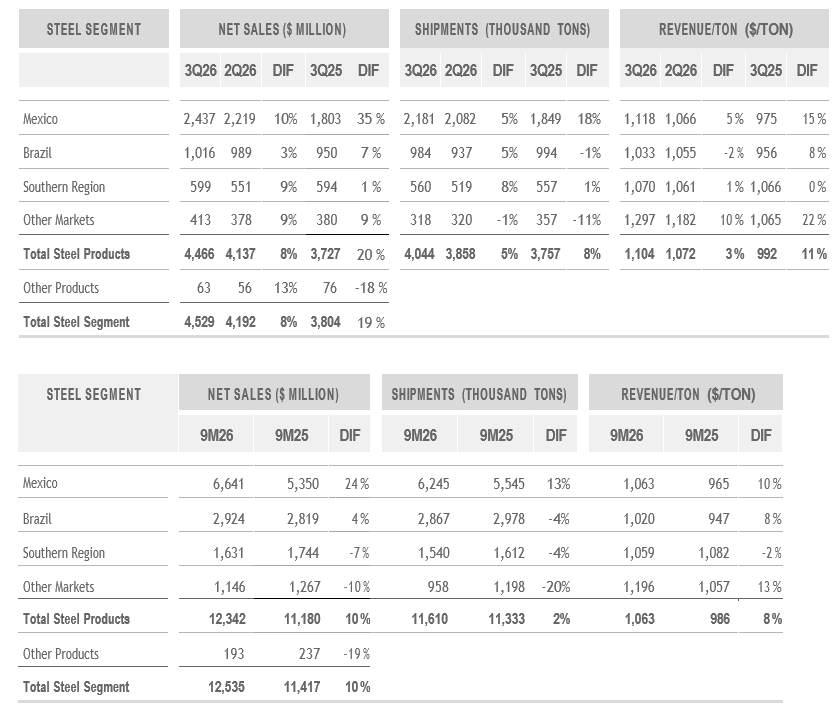
The Steel Segment's net sales increased both sequentially and year over year in the third quarter of 2026, driven by higher shipments and revenue per ton. Compared with the previous quarter, sales volumes increased in
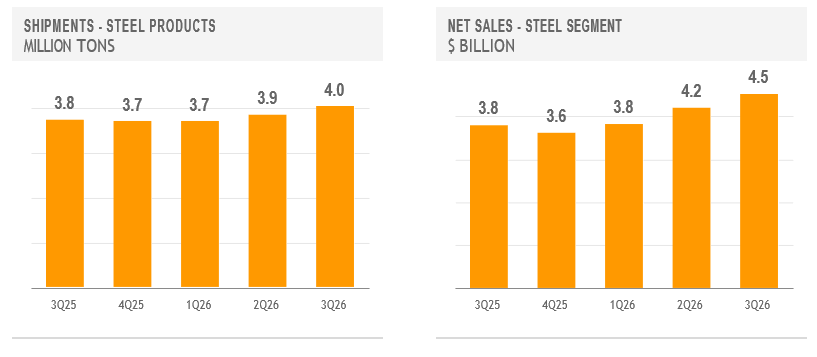
In the third quarter of 2026,
In
In Other Markets, shipments in the third quarter of 2026 were broadly stable sequentially, while decreasing slightly on a year-over-year basis.
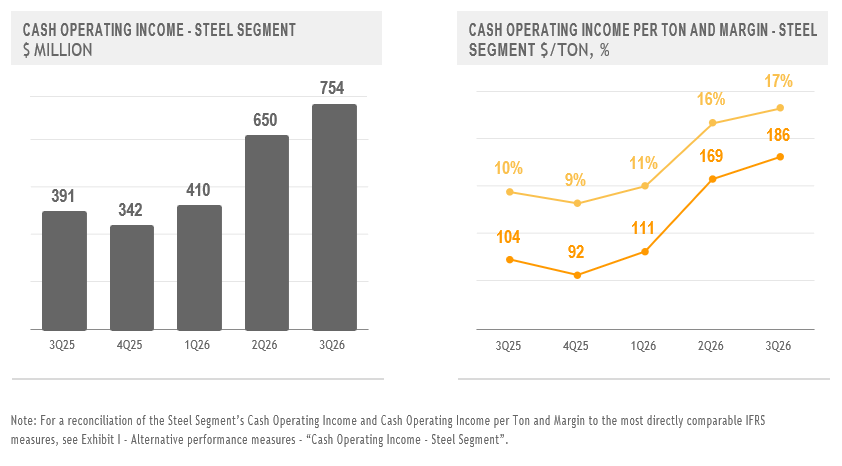
In the third quarter of 2026, the Steel Segment's Cash Operating Income rose by
The increase in cost per ton was mainly the result of higher raw material and purchased slab prices, partially offset by the company's ongoing initiatives to improve efficiency.
Mining Segment Third Quarter of 2026 Results
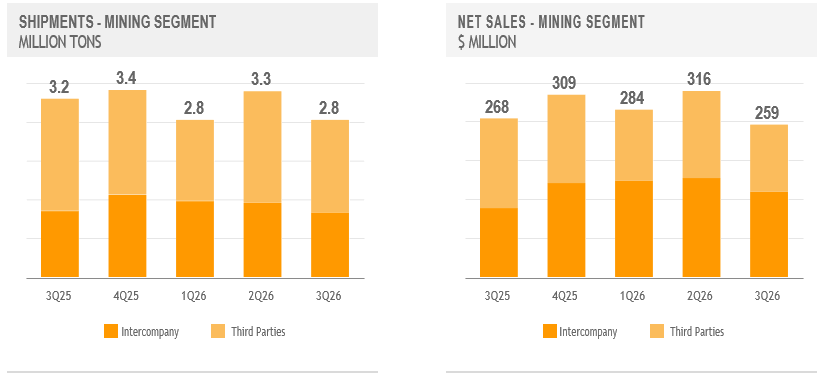
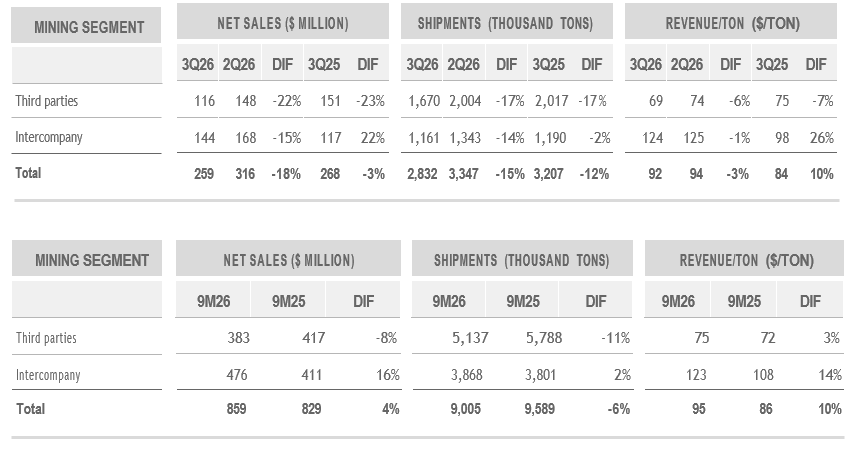
Net sales in the Mining Segment decreased by 18% sequentially in the third quarter of 2026, reflecting lower sales volumes and a slight decline in realized iron ore prices. Year-over-year, net sales decreased slightly in the third quarter, as the decline in sales volumes was mostly offset by higher realized iron ore prices. Sales volumes in the third quarter were affected by the temporary suspension of certain operations at Mineração Usiminas, following a deterioration in iron ore export profitability.
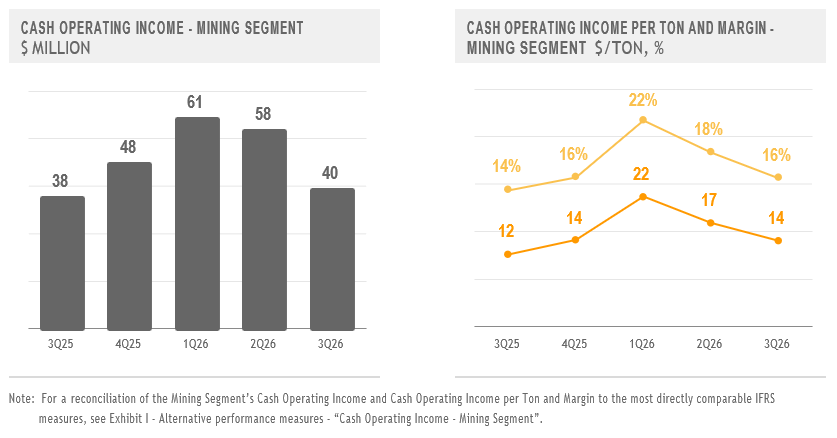
The Mining Segment's Cash Operating Income decreased sequentially in the third quarter of 2026, primarily driven by a decline in sales volumes and lower realized iron ore prices. On a year-over-year basis, Cash Operating Income rose slightly reflecting higher realized iron ore prices, which were largely offset by lower shipments and increased costs.
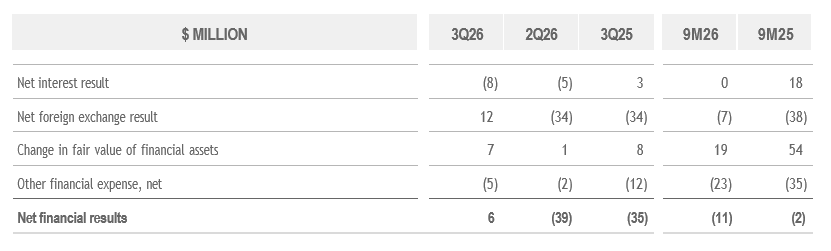
Net Financial Results
Net financial results were a gain of
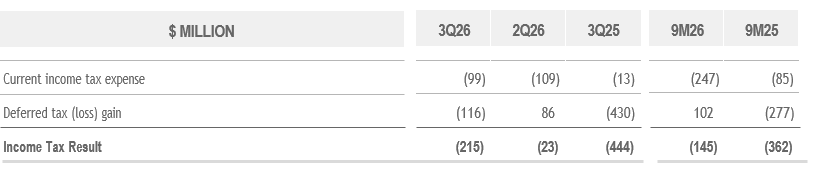
Income Tax Results
Net Income
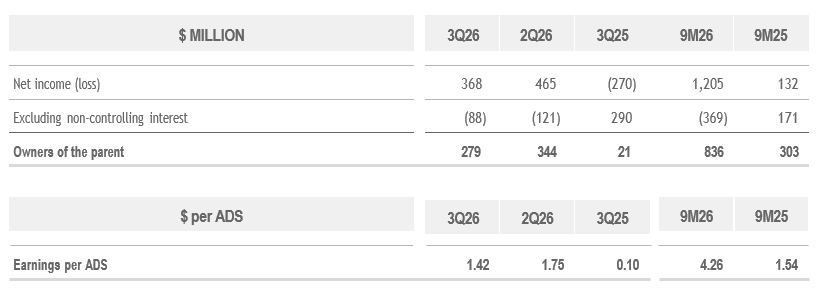
In the third quarter of 2026,
Equity Holder's Net Income was
Cash Flow and Liquidity
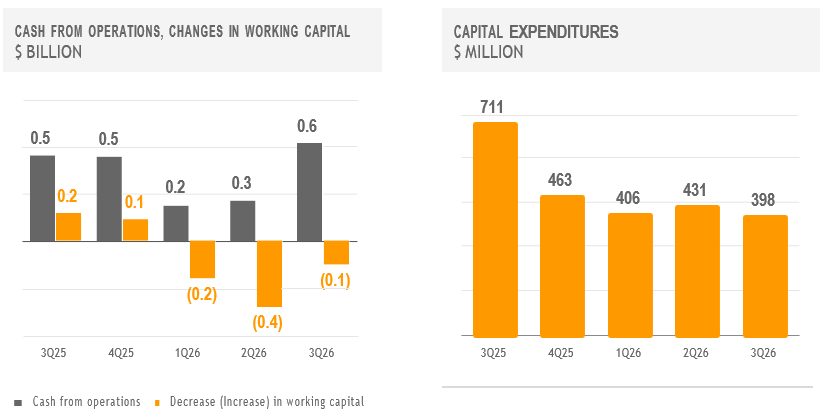
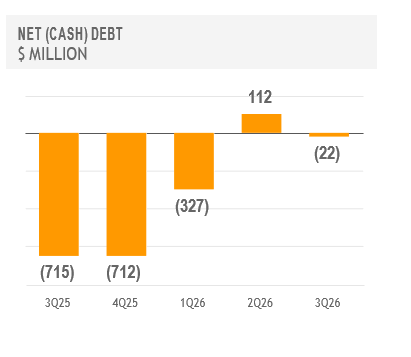
In the third quarter of 2026, cash from operations amounted to
Capital expenditures totaled
Conference Call and Webcast
Forward Looking Statements
Some of the statements contained in this press release are "forward-looking statements". Forward-looking statements are based on management's current views and assumptions and involve known and unknown risks that could cause actual results, performance or events to differ materially from those expressed or implied by those statements. These risks include but are not limited to risks arising from uncertainties as to gross domestic product, related market demand, global production capacity, tariffs, cyclicality in the industries that purchase steel products, and other factors beyond
About
Income Statement
| $ MILLION | 3Q26 | 2Q26 | 3Q25 | 9M26 | 9M25 | |||||||||||||||
Net sales | 4,644 | 4,340 | 3,955 | 12,919 | 11,834 | |||||||||||||||
Cost of sales | (3,608 | ) | (3,399 | ) | (3,346 | ) | (10,254 | ) | (10,085 | ) | ||||||||||
Gross profit | 1,037 | 941 | 608 | 2,664 | 1,749 | |||||||||||||||
Selling, general and administrative expenses | (448 | ) | (428 | ) | (396 | ) | (1,266 | ) | (1,195 | ) | ||||||||||
Other operating income (expense), net | (11 | ) | 15 | 3 | (2 | ) | (8 | ) | ||||||||||||
Operating income | 578 | 528 | 215 | 1,396 | 546 | |||||||||||||||
Financial expense | (53 | ) | (50 | ) | (53 | ) | (153 | ) | (164 | ) | ||||||||||
Financial income | 45 | 45 | 56 | 154 | 182 | |||||||||||||||
Other financial income (expense), net | 14 | (34 | ) | (37 | ) | (12 | ) | (19 | ) | |||||||||||
Equity in earnings of non-consolidated companies | 19 | 22 | 25 | 56 | 65 | |||||||||||||||
Provision for ongoing litigation related to the acquisition of a participation in Usiminas | (20 | ) | (24 | ) | (32 | ) | (92 | ) | (117 | ) | ||||||||||
Profit before income tax result | 583 | 487 | 174 | 1,350 | 494 | |||||||||||||||
Income tax | (215 | ) | (23 | ) | (444 | ) | (145 | ) | (362 | ) | ||||||||||
Profit (loss) for the period | 368 | 465 | (270 | ) | 1,205 | 132 | ||||||||||||||
Attributable to: | ||||||||||||||||||||
Owners of the parent | 279 | 344 | 21 | 836 | 303 | |||||||||||||||
Non-controlling interest | 88 | 121 | (290 | ) | 369 | (171 | ) | |||||||||||||
Profit (loss) for the period | 368 | 465 | (270 | ) | 1,205 | 132 | ||||||||||||||
Statement of Financial Position
$ MILLION | ||||||||
Property, plant and equipment, net | 11,194 | 10,406 | ||||||
Intangible assets, net | 1,049 | 1,002 | ||||||
Investments in non-consolidated companies | 626 | 563 | ||||||
Other investments | 0 | 0 | ||||||
Deferred tax assets | 1,215 | 1,039 | ||||||
Receivables, net | 721 | 804 | ||||||
Trade receivables, net | 5 | 4 | ||||||
Total non-current assets | 14,812 | 13,819 | ||||||
Receivables, net | 710 | 985 | ||||||
Derivative financial instruments | 7 | 43 | ||||||
Inventories, net | 4,483 | 4,094 | ||||||
Trade receivables, net | 2,107 | 1,536 | ||||||
Other investments | 1,760 | 1,600 | ||||||
Cash and cash equivalents | 1,355 | 1,531 | ||||||
Total current assets | 10,423 | 9,788 | ||||||
Non-current assets classified as held for sale | 8 | 8 | ||||||
Total assets | 25,243 | 23,615 | ||||||
Statement of Financial Position (cont.)
$ MILLION | ||||||||
Capital and reserves attributable to the owners of the parent | 12,541 | 11,944 | ||||||
Non-controlling interest | 4,517 | 4,203 | ||||||
Total equity | 17,058 | 16,148 | ||||||
Provisions | 594 | 586 | ||||||
Deferred tax liabilities | 31 | 24 | ||||||
Non current tax liabilities | 6 | 13 | ||||||
Other liabilities | 989 | 956 | ||||||
Trade payables | 1 | 1 | ||||||
Lease liabilities | 176 | 138 | ||||||
Borrowings | 2,306 | 1,815 | ||||||
Total non-current liabilities | 4,104 | 3,533 | ||||||
Provision for ongoing litigation related to the acquisition of a participation in Usiminas | 619 | 528 | ||||||
Current income tax liabilities | 126 | 39 | ||||||
Other liabilities | 486 | 640 | ||||||
Trade payables | 2,013 | 2,073 | ||||||
Derivative financial instruments | 0 | 1 | ||||||
Lease liabilities | 49 | 49 | ||||||
Borrowings | 787 | 604 | ||||||
Total current liabilities | 4,081 | 3,934 | ||||||
Total liabilities | 8,185 | 7,467 | ||||||
Total equity and liabilities | 25,243 | 23,615 | ||||||
Statement of Cash Flows
| $ MILLION | 3Q26 | 2Q26 | 3Q25 | 9M26 | 9M25 | |||||||||||||||
Result for the period | 368 | 465 | (270 | ) | 1,205 | 132 | ||||||||||||||
Adjustments for: | ||||||||||||||||||||
Depreciation and amortization | 198 | 194 | 197 | 572 | 578 | |||||||||||||||
Income tax accruals less payments | 169 | 3 | 394 | 42 | 142 | |||||||||||||||
Equity in earnings of non-consolidated companies | (19 | ) | (22 | ) | (25 | ) | (56 | ) | (65 | ) | ||||||||||
Provision for ongoing litigation related to the acquisition of a participation in Usiminas | 20 | 24 | 32 | 92 | 117 | |||||||||||||||
Interest accruals less payments / receipts, net | (17 | ) | (4 | ) | (6 | ) | (27 | ) | (6 | ) | ||||||||||
Changes in provisions | 4 | (10 | ) | 1 | (5 | ) | 5 | |||||||||||||
Changes in working capital | (148 | ) | (418 | ) | 174 | (798 | ) | 901 | ||||||||||||
Net foreign exchange results and others | 38 | 24 | 38 | 62 | (17 | ) | ||||||||||||||
Net cash provided by operating activities | 613 | 256 | 535 | 1,086 | 1,786 | |||||||||||||||
Capital expenditures and advances to suppliers for PP&E | (398 | ) | (431 | ) | (711 | ) | (1,235 | ) | (2,038 | ) | ||||||||||
(Increase) decrease in other investments | (529 | ) | 288 | (24 | ) | (153 | ) | 538 | ||||||||||||
Proceeds from the sale of property, plant & equipment | 1 | 0 | 3 | 2 | 4 | |||||||||||||||
Dividends received from non-consolidated companies | 1 | 1 | 2 | 3 | 4 | |||||||||||||||
Recovery of loans from non-consolidated companies | - | - | - | 150 | - | |||||||||||||||
Acquisition of additional participation in Usiminas | - | - | - | (315 | ) | - | ||||||||||||||
Acquisition of business - purchase consideration | - | - | - | (24 | ) | - | ||||||||||||||
Acquisition of business - cash acquired | - | - | - | 4 | - | |||||||||||||||
Repayment of additional paid in capital | - | - | - | - | (5 | ) | ||||||||||||||
Net cash used in investing activities | (925 | ) | (142 | ) | (729 | ) | (1,568 | ) | (1,497 | ) | ||||||||||
Dividends paid in cash to company's shareholders | - | (255 | ) | - | (255 | ) | (353 | ) | ||||||||||||
Dividends paid in cash to non-controlling interest | - | (36 | ) | - | (43 | ) | (2 | ) | ||||||||||||
Finance lease payments | (15 | ) | (18 | ) | (15 | ) | (48 | ) | (50 | ) | ||||||||||
Proceeds from borrowings | 334 | 29 | 71 | 768 | 653 | |||||||||||||||
Repayments of borrowings | (77 | ) | (19 | ) | (387 | ) | (135 | ) | (934 | ) | ||||||||||
Net cash provided by (used in) financing activities | 242 | (300 | ) | (330 | ) | 288 | (686 | ) | ||||||||||||
Decrease in cash and cash equivalents | (70 | ) | (186 | ) | (524 | ) | (195 | ) | (397 | ) | ||||||||||
Exhibit I - Alternative Performance Measures
These non-IFRS measures should not be considered in isolation of, or as a substitute for, measures of performance prepared in accordance with IFRS. These non-IFRS measures do not have a standardized meaning under IFRS and, therefore, may not correspond to similar non-IFRS financial measures reported by other companies.
Adjusted EBITDA
$ MILLION | 3Q26 | 2Q26 | 3Q25 | 9M26 | 9M25 | |||||||||||||||
Net income | 368 | 465 | (270 | ) | 1,205 | 132 | ||||||||||||||
Adjusted to exclude: | ||||||||||||||||||||
Depreciation and amortization | 198 | 194 | 197 | 572 | 578 | |||||||||||||||
Income tax results | 215 | 23 | 444 | 145 | 362 | |||||||||||||||
Net financial results | (6 | ) | 39 | 35 | 11 | 2 | ||||||||||||||
Equity in earnings of non-consolidated companies | (19 | ) | (22 | ) | (25 | ) | (56 | ) | (65 | ) | ||||||||||
Provision for ongoing litigation related to the acquisition of a participation in Usiminas | 20 | 24 | 32 | 92 | 117 | |||||||||||||||
Reversal of contingencies (Usiminas) | - | (12 | ) | - | (12 | ) | - | |||||||||||||
Adjusted to include: | ||||||||||||||||||||
Proportional EBITDA in | 9 | 7 | 8 | 24 | 21 | |||||||||||||||
Adjusted EBITDA | 785 | 717 | 420 | 1,981 | 1,146 | |||||||||||||||
Divided by: net sales | 4,644 | 4,340 | 3,955 | 12,919 | 11,834 | |||||||||||||||
Adjusted EBITDA Margin (%) | 17 | % | 17 | % | 11 | % | 15 | % | 10 | % | ||||||||||
Exhibit I - Alternative Performance Measures (cont.)
Cash Operating Income - Steel Segment
| $ MILLION | 3Q26 | 2Q26 | 3Q25 | 9M26 | 9M25 | |||||||||||||||
Operating Income - Management View (Note "Segment Information" to | 504 | 410 | 333 | 1,185 | 766 | |||||||||||||||
Plus/minus differences in cost of sales (IFRS) | 77 | 88 | (96 | ) | 148 | (202 | ) | |||||||||||||
Excluding depreciation and amortization | 163 | 158 | 146 | 469 | 432 | |||||||||||||||
Excluding reversal of contingencies (Usiminas) | - | (12 | ) | - | (12 | ) | - | |||||||||||||
Including proportional EBITDA in | 9 | 7 | 8 | 24 | 21 | |||||||||||||||
Cash Operating Income | 754 | 650 | 391 | 1,814 | 1,018 | |||||||||||||||
Divided by: steel shipments (thousand tons) | 4,044 | 3,858 | 3,757 | 11,610 | 11,333 | |||||||||||||||
Cash Operating Income per Ton - Steel | 186 | 169 | 104 | 156 | 90 | |||||||||||||||
Divided by: steel net sales | 4,529 | 4,192 | 3,804 | 12,535 | 11,417 | |||||||||||||||
Cash Operating Income Margin - Steel (%) | 17 | % | 16 | % | 10 | % | 14 | % | 9 | % | ||||||||||
Cash Operating Income - Mining Segment
| $ MILLION | 3Q26 | 2Q26 | 3Q25 | 9M26 | 9M25 | |||||||||||||||
Operating Result - Management View (Note "Segment Information" to | (54 | ) | (33 | ) | (35 | ) | (112 | ) | (75 | ) | ||||||||||
Plus/minus differences in cost of sales (IFRS) | 59 | 55 | 23 | 168 | 77 | |||||||||||||||
Excluding depreciation and amortization | 35 | 36 | 51 | 104 | 146 | |||||||||||||||
Cash Operating Income | 40 | 58 | 38 | 160 | 148 | |||||||||||||||
Divided by: mining shipments (thousand tons) | 2,832 | 3,347 | 3,207 | 9,005 | 9,589 | |||||||||||||||
Cash Operating Income per Ton - Mining | 14 | 17 | 12 | 18 | 15 | |||||||||||||||
Divided by: mining net sales | 259 | 316 | 268 | 859 | 829 | |||||||||||||||
Cash Operating Income Margin - Mining (%) | 16 | % | 18 | % | 14 | % | 19 | % | 18 | % | ||||||||||
Exhibit I - Alternative Performance Measures (cont.)
Free Cash Flow
| $ MILLION | 3Q26 | 2Q26 | 3Q25 | 9M26 | 9M25 | |||||||||||||||
Net cash provided by operating activities | 613 | 256 | 535 | 1,086 | 1,786 | |||||||||||||||
Less: capital expenditures and advances to suppliers for PP&E | (398 | ) | (431 | ) | (711 | ) | (1,235 | ) | (2,038 | ) | ||||||||||
Free Cash Flow | 215 | (175 | ) | (175 | ) | (149 | ) | (252 | ) | |||||||||||
Net (Cash) Debt
| $ MILLION | 2026 | 2026 | 2025 | |||||||||
Borrowings (current and non-current) | 3,094 | 2,844 | 2,046 | |||||||||
Less: Cash and cash equivalents | (1,355 | ) | (1,431 | ) | (1,323 | ) | ||||||
Less: Other investments (current and non-current) | (1,760 | ) | (1,301 | ) | (1,438 | ) | ||||||
Net (Cash) Debt | (22 | ) | 112 | (715 | ) | |||||||
Note:
Sebastián Martí
+1 (866) 890 0443
+54 (11) 4018 8389
www.ternium.com
SOURCE:
View the original press release on ACCESS Newswire